

Within the ecosystem of automated testing tools, Selenium WebDriver has been a mainstay of the category of tools providing browser automation. If you are new to automation, you might be wondering, What is Selenium WebDriver?
In its simplest form, it is a framework that allows testers and developers to control browsers in code as a user would by performing clicks, typing text, navigating to links and much more. Most users of WebDriver do so through commands. Very few have delved into the protocol-level mechanisms that facilitate those programmatic interactions with the browser. This is where tools like Wireshark come into play to show us what is happening on the back end.
This blog post is intended to explore the ins and outs of Selenium WebDriver, focusing on protocol-level communication and the use of Wireshark to gain a deeper understanding of what your test scripts are actually doing. Regardless of whether you are a QA engineer, developer, or DevOps, understanding WebDriver to this degree will enable you to debug, optimize and secure your automation.
The Layers Beneath: Understanding Selenium’s Architecture
It is very important to first understand the Selenium WebDriver architecture before getting into the process of debugging it. The majority of users are accustomed to writing tests in such languages as Java, Python, or JavaScript. The Selenium client libraries are employed in issuing commands in these tests. But what do these commands lead to?
Simply put, this is the way Selenium WebDriver functions:
- Test Script: That is your own code, the commands that you have coded by using the Selenium API.
- Client Binding: This translates your test code using a binding to WebDriver Protocol commands.
- WebDriver Server: A browser-specific server (like ChromeDriver or GeckoDriver) that listens for those commands.
- Browser: The server controls the browser using native APIs or browser extensions.
The magic lies in the WebDriver Protocol, officially part of the W3C, which defines communication between a client and server. Every command, such as “click this button” or “go to this page,” is then translated to an HTTP request (normally in JSON format) and transmitted to the WebDriver server via HTTP.
And that’s exactly what Wireshark can help you observe.
What Is Wireshark and Why Use It?
Wireshark is a free and open-source packet analyzer. In simple terms, this means that you can see all the traffic that flows through your computer’s networking interfaces down to the actual packet headers and payloads. This tool is primarily used for network analysis or protocol analysis, but it’s also an extremely powerful tool for understanding what happens behind the scenes in Selenium.
A WebDriver command becomes a network transaction when it is executed. That means:
- The client (your script) issues an HTTP request.
- The WebDriver server (like ChromeDriver) hands back some data.
Wireshark can be used to capture and interrogate this interaction. You are able to view the actual JSON request, what endpoint was called (e.g., /session, /element, or /click), and the response of the server. This is noteworthy information to have when you’re debugging a failure, optimizing performance or building some custom integrations.
Why Protocol-Level Debugging Matters
Most of the time, automation framework bugs are diagnosed at the surface level. You are aware that some tests have failed and could have the stack trace or even some screenshots. But this may not be sufficient in some situations, particularly in complex environments.
The following are some of the situations in which protocol-level debugging using Wireshark can be immensely helpful:
- Element Click Failures: Where did the element click stop working? Did your requests hit the server? Was there a response from the server, but it was distorted?
- Session Timeouts or Failures: You can follow the session initiation and teardown to help in understanding what’s wrong.
- Cross-language Issues: The client libraries may behave slightly differently. Wireshark helps verify that the base protocol remains consistent.
- Security Audits: Verifying that any sensitive data doesn’t get sent in clear text.
- Performance Tuning: Checking the latency and response times of the WebDriver commands.
The thing is that protocol-level visibility enables you to inspect, troubleshoot, and optimize your test in a way that dashboards and stack traces can never afford.
It is also worth acknowledging that although tools such as Wireshark are good at helping us debug issues at the packet level, AI testing tools such as LambdaTest simplify the debugging process, especially when working across multiple browsers, devices, and platforms. They automatically log activities, capture network traffic, record videos, and provide real-time views of tests as they run, making it easier to identify and resolve issues efficiently.
It also comes with KaneAI – an AI agent for QA testing to transform test automation by enabling users to create, manage, and debug tests using natural language. This AI assistant simplifies the testing process, making it more accessible and efficient.
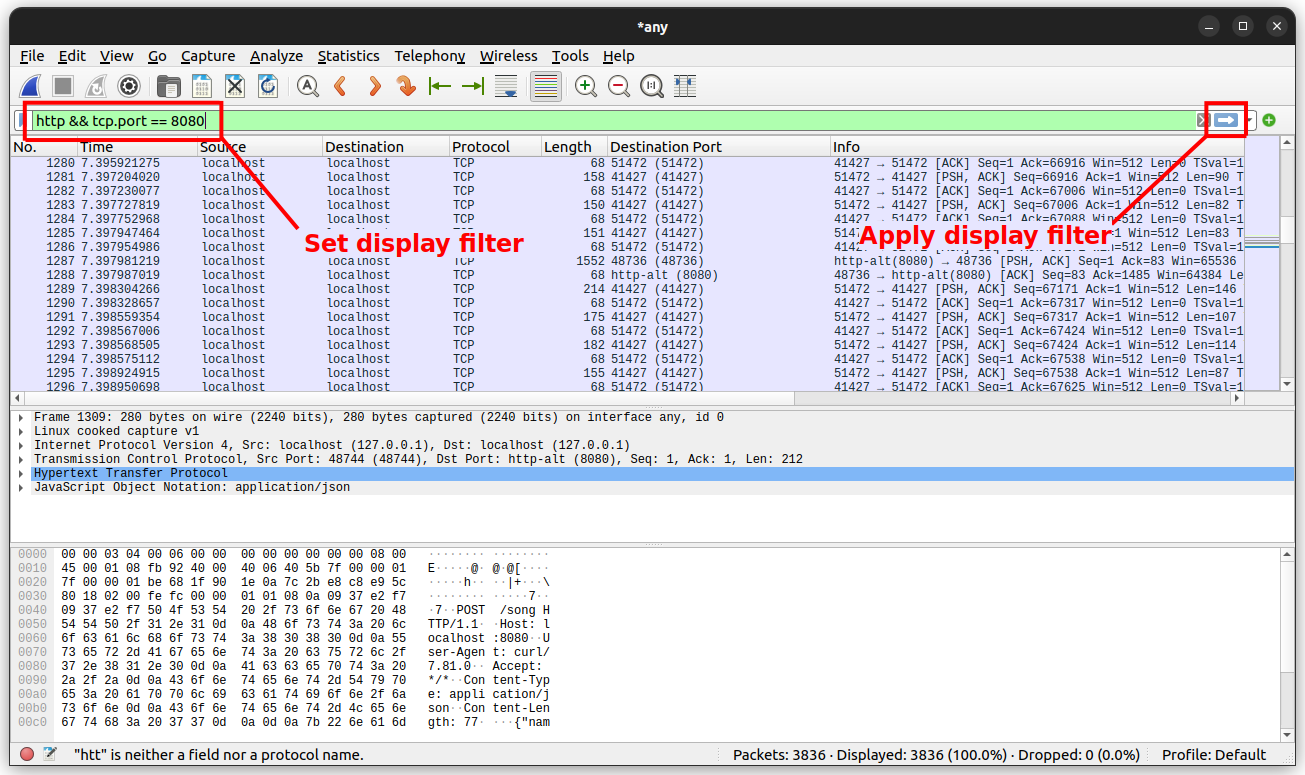
Capturing WebDriver Traffic with Wireshark
Having said that we now understand why it’s valuable to have visibility into the protocol, let’s turn now to how Wireshark helps you capture WebDriver traffic.
Selenium WebDriver clients make requests to the browser driver through HTTP by default. To take an example, say you are using ChromeDriver, your client will be making an HTTP request to localhost:9515 where ChromeDriver will be listening.
Wireshark captures all traffic across the network, including localhost traffic (but you may need to set certain parameters to capture loopback, depending on your operating system).
When you capture traffic you’ll be able to:
- Filter by IP or port number (e.g., port 9515 for Chrome Driver).
- Filter to isolate HTTP requests: http.request.
- You can review headers, JSON payloads, and response status codes.
What an HTTP request has to do with your tests is that raw data can expose inconsistencies or unexpected values creating issues with your tests.
Dissecting the WebDriver Protocol
The WebDriver W3C protocol is essentially a REST-like API. When you perform an action (locating an element, sending keys, clicking, etc.), you are making, essentially, a RESTful request. Here is an example request flow:
- Starting the session: A POST request to /session with the required browser capabilities.
Command Execution: Requests like:
POST /session/{id}/element Request to find an element.
POST /session/{id}/element/{element-id}/click Request to click.
GET /session/{id}/screenshot Request to click a screenshot.
Ending the session: A DELETE request to /session/{id}.
There are headers and a body in every request. The body can contain parameters (like the locator strategies, element IDs, or input values). The response usually will come back with a success status and any returned data.
When you are using Wireshark, you can see each of these requests and responses, offering a complete picture of your session lifecycle.
Advanced Topics: Beyond HTTP
Selenium is always evolving. As a result, new forms of communication are always being developed. WebSocket communication, particularly the Chrome DevTools Protocol (CDP) integration, is a perfect example of this new approach.
While traditional WebDriver uses HTTP for communication, other automation tools may also support WebSocket in future versions. WebSocket offers a bi-directional communication opportunity. However, if you need to know more about WebSocket, Wireshark will get you covered as it can analyze WebSocket traffic, frame analysis, payload analysis, and timing.
Understanding the direction toward WebSocket helps you prepare for how you will need to debug in the future. This is especially true for advanced automation use cases, like performance auditing or browser instrumentation.
Bridging the Gap Between Dev and QA
One often unnoticed benefit of having protocol-level visibility is helping bridge the gap between development and QA.
If testers are able to show developers the exact sequence of HTTP/WebDriver requests in a test execution, it adds clarity for:
- Bug reporting, with clear, reproducible evidence.
- The validation of whether a particular backend or frontend issue is or is not the result of the test script.
- Building more reliable test environments by aligning the tools Devs and QAs use.
By being able to speak the same “protocol language,” it allows cross-team collaboration to resolve issues faster.
Security Considerations
When discussing protocol-level traffic, security becomes an important topic. Although Selenium typically runs locally, there are cases when the communication occurs across the network.
Considerations such as the following may be ensured with the use of Wireshark:
- Passwords and usernames are not sent in plain text.
- Token leakage across requests does not occur.
- Unauthorized entry is blocked either through open ports or improperly configured driver properties.
By viewing traffic, teams can check their test environments against common vulnerabilities—this is an important process to do when tests run in CI/CD environments or cloud frameworks.
Common Challenges in Protocol Debugging
Although protocol level debugging is incredibly useful, it does have its challenges:
- Syntax Overload: Because Wireshark captures everything, filtering is important.
- Loopback Traffic Configuration: Certain OS configurations do not provide a way to capture localhost.
- Encrypted Traffic: WebDriver servers can be configured with HTTPS (although it’s rare, it is possible) so traffic may be encrypted.
- Miscalculating Delay: Delay does not mean latency failure; there are delays that are part of browser performance.
When you address the challenges, you can better situate your interpretation of the Wireshark output and avoid misdiagnosing.
Future of WebDriver and Debugging Needs
The future of Selenium is intimately connected to the modern web ecosystem. With a stronger focus being placed on browser-native debugging protocols, headless execution, and cloud-based automation, protocol-level debugging will only grow in need.
In future versions you may be:
- Fully transitioned to WebSocket based protocols
- Additional observability hooks in browser drivers
- New drivers developed from other transport mediums.
Whatever mode of transport you use, the need for transparent communication analysis will remain, and tools like Wireshark will continue to be important for testers in keeping up with modernity.
Final Thoughts
So, what is Selenium, really? At its essence, it’s not just a testing framework. It’s a distributed control framework that is acting as a façade over a network protocol, which is controlling the browser by sending commands to the browser. Naturally, like any distributed system, what matters the most is whatever clarity is given about the communication.
A practical understanding of the internals of Selenium WebDriver—how it communicates as a coordinated control system—isn’t simply functional; it allows you to debug difficult bugs, improve performance, and harden your test stack. Tools like Wireshark allow you to do this by removing the abstraction and showing you packets—in effect, showing reality one packet at a time.
If you’ve never looked at your WebDriver tests through the perspective of network traffic, it is time to do so. You will likely become a better tester or developer, and you will appreciate the beauty (and the complexity) of what Selenium is, just a little more.